Developer Tools (DevTools) Panel
In both Vivaldi and Google Chrome, Ctrl + Shift + I opens the browser's Developer Tools (DevTools) panel. You can also open with F12.
In Vivaldi, look in the Console tab for any errors. They are shown with a cross and a highlighted background, with the first error displayed automatically.
The following screenshot shows an example:
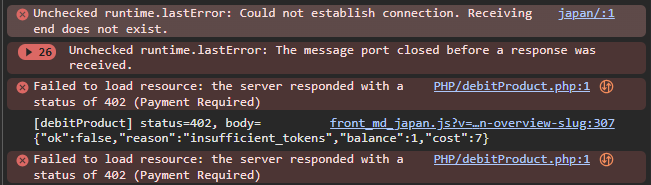
The Console displays errors encountered while loading or running the webpage, including the affected file or resource, the type of error, and HTTP error codes such as 402 (Payment Required).
In this example, the first two errors appear to relate to a browser extension or messaging connection, while the third shows that debitProduct.php failed to load because the server returned HTTP 402.
Topic last reviewed: 01/09/26